
Chart Archive
-
Research Reference
Write your awesome label here.
overview
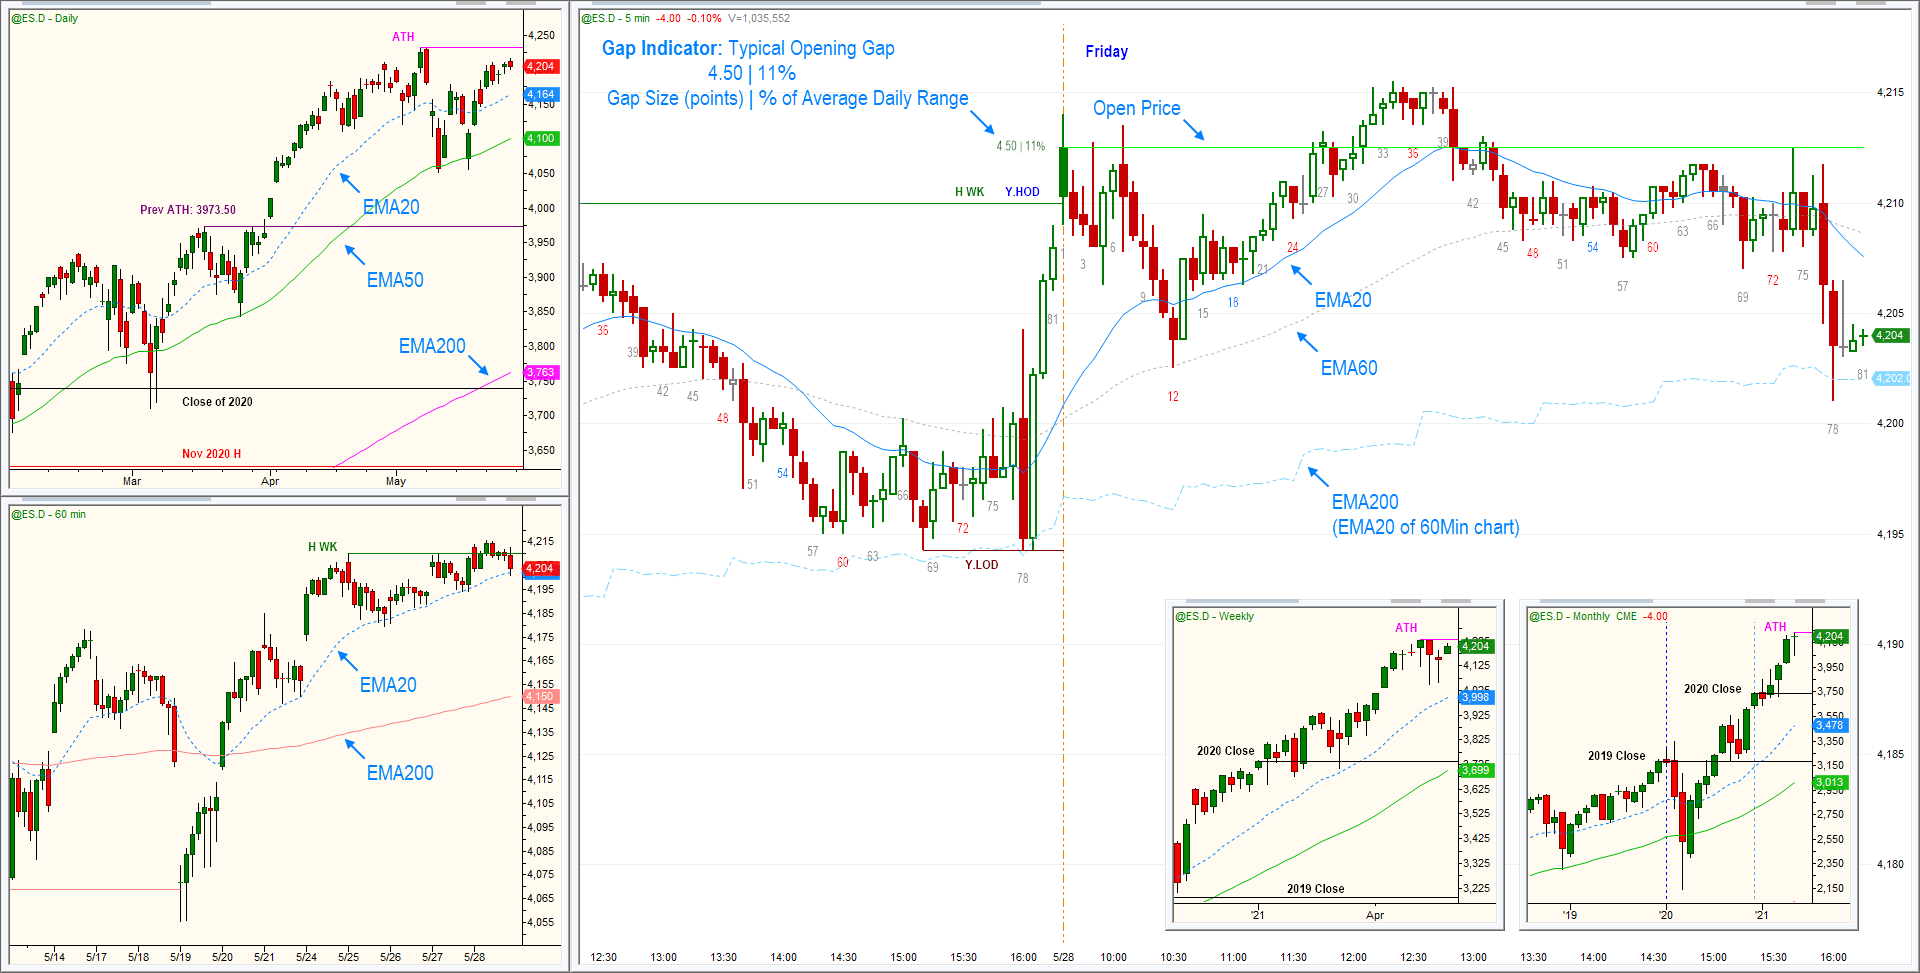
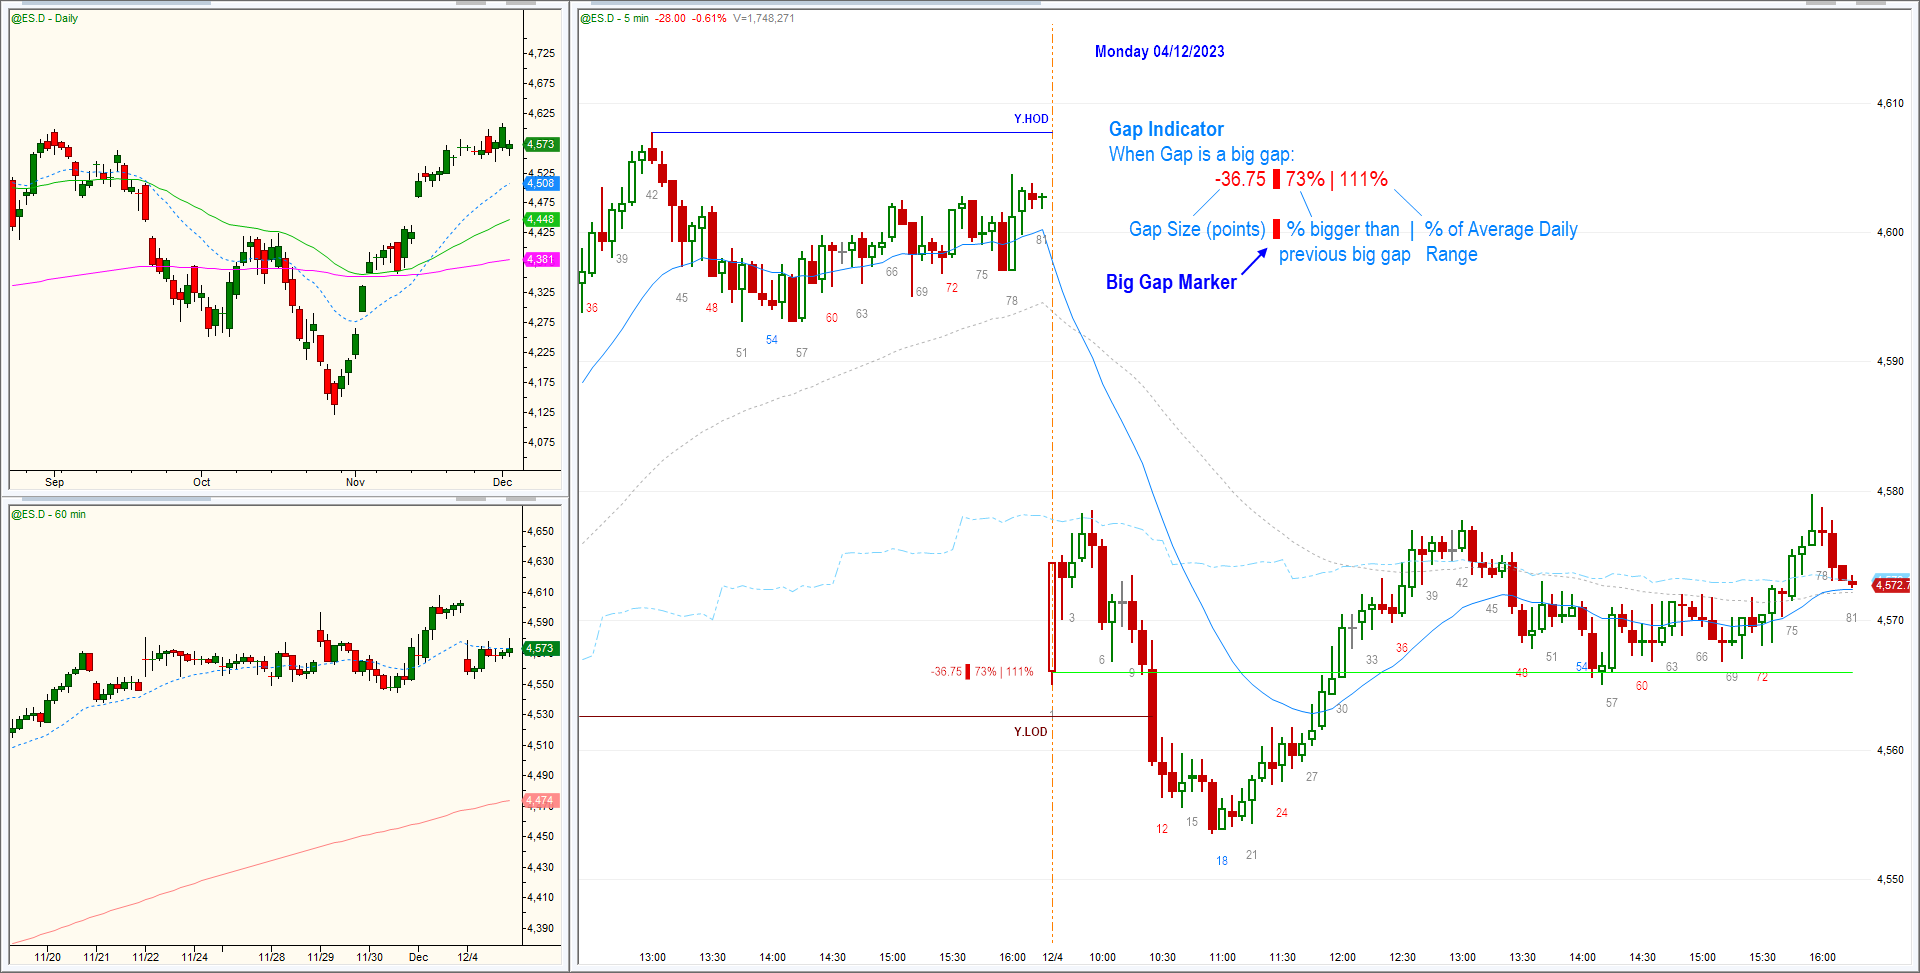
This module contains historical 5 min intraday charts of ES from Ali's archive:
-
2015: 241 charts
-
2016: 256 charts
-
2017: 251 charts
-
2018: 254 charts
-
2019: 253 charts
-
2020: 255 charts
-
2021: 253 charts
-
2022: 249 charts
-
2023: 248 charts
-
2024: 250 charts
Format
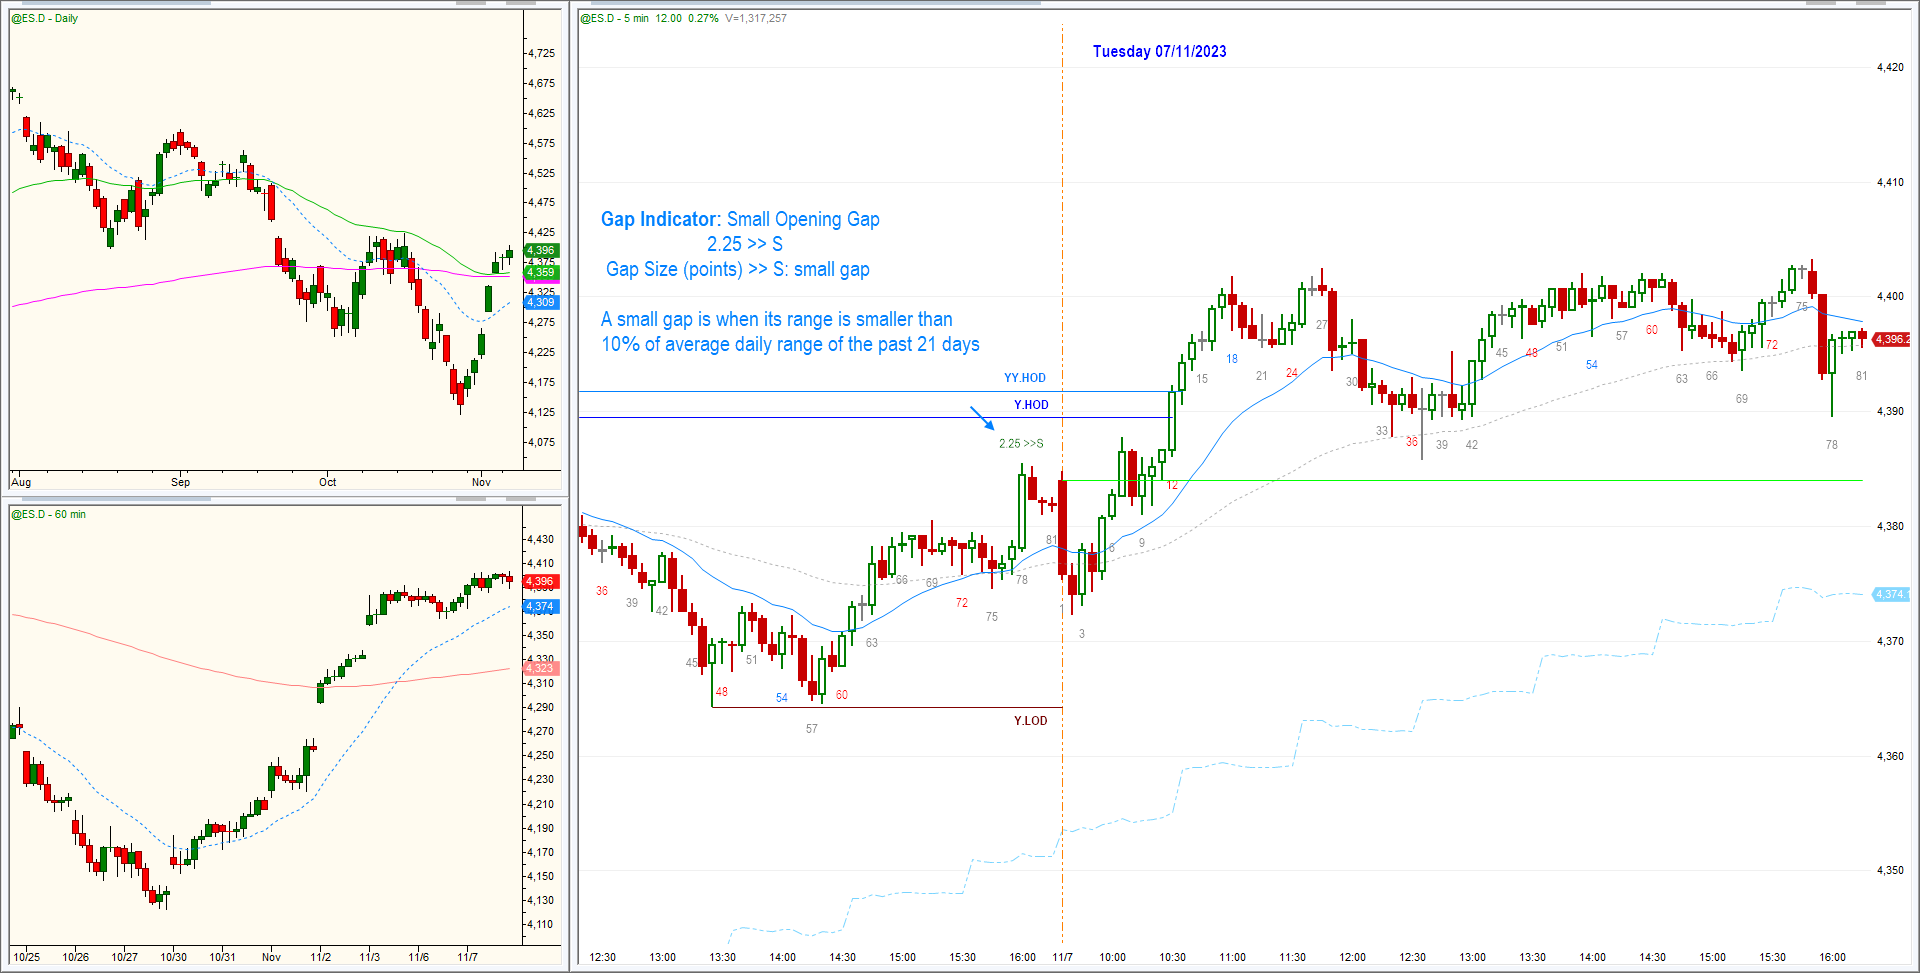
Indicators
File Name Convention
Chart Archive
Use your downtime productively
Write your awesome label here.
How to Use this Archive
Note on this Archive
Ali Moin-Afshari
Systematic Trader
ABOUT ALI
Ali Moin-Afshari is the founder of Quant Systems and course creator of the Systems Academy program. He has had a successful +20-year career in IT and telecom, working as an architect, consultant, and founder of two IT companies. He began his trading career initially as a side business in 2007 and became a full time trader in 2014. He is a systems expert and has designed, developed, and programed more than 200 trading systems.