Position sizing is the component responsible for the variability of trading results. Two traders can trade the same instrument using the exact same entries and exits but implement different position sizing methods. The difference in their results will be significant.
Futures traders trade leveraged instruments intraday. They frequently get into situations that require scaling into or out of positions to maximize their probability of success, this process is also referred to as managing the trade. During the day, a lot happens on the chart, so reducing the overhead is important in order to free up mental resources as much as possible and to preserve traders’ energy to allow them to efficiently trade many consecutive hours every day.
In the military, complex tasks are broken down into small simple steps and put into checklists or computerized menus to shorten the decision-making lag, task completion time, and to prevent mistakes as much as possible. Traders can do the same for many of the different trading tasks, including position sizing. An easy straight-forward way would be creating a programmable reference table in Excel.
The first step is to decide what percentage of your trading capital you can risk per trade without endangering your account (possibility of ruin) or under exposing it (performance loss).
I am not going to get into the math and statistics of performance analysis and position sizing in this article. However, I must provide some background so that you can use a simple practical common-sense method to estimate the approximate capital exposure percentages for the trader that you are.
When quants design a trading system, they measure the performance of the system by running it on historical market data. The process is called back testing. One of the pieces of statistical data they calculate is called the System Quality Number or Z-Score. It means if the system in question is traded in the future, how close would the performance be to the results of the back testing. The higher the Z score, the closer the two will be, which means the system is higher quality. What makes Z score rise is similarity of profit sizes and a high win rate, in other words a low standard deviation of samples drives the Z score up. So Z score and standard deviation of trade results have an opposite relationship. When standard deviation goes down, Z score goes up and vice-versa.
Isn’t this the hallmark of great traders? They produce repeatable great results that are quite similar across different time periods. Such traders can increase their exposure to risk (percent capital at risk) because their Z score is high. Beginners on the other hand, usually produce big winners and big or bigger losers and more of them. As a result the standard deviation of their trades is a big number indicating a big variance in trade results, which reduces their Z score. Therefore, new traders must risk a much smaller percentage of their capital to stay in the game long term.
You don’t need statistical calculations to decide what the right risk for your trading is. Collect your statements and look at your performance. If you are profitable overall, then look for the following major scenarios:
- You have a string of small, almost equally sized winners and few losing trades that are smaller or equal to the winners.
- The winners are of all sizes, so are the losers, but overall you win more therefore you are profitable.
- Most of your profit comes from a few big winning trades. The losses are mostly equal to wins and offset most of the small winners, allowing those really big winners to keep you profitable.
You can risk more in scenario number 1, less in 2, and the least in 3, because as we go down the list the standard deviation of samples increase, which means the quality of trading drops. A lower quality trader must risk less because one of those big losses can wipe out a big portion of accumulated profits and results of days or months of work.
The very best trading systems with a Z score of 5 and above (few exist) can be traded with as much as three to four percent capital exposure per trade (initial risk). I assume you already know the difference between initial and actual risk.
Experienced traders with years of successful trading behind them, the really good traders, can risk that much. Most trading systems and most traders, fall in the Z score range of 2 to 3.5, which means they must not risk more than 2% of their capital on each trade, even that is a little too high. Less experienced traders must never risk more than 1%. Beginners must trade the minimum size, one contract or options of a similar instrument, so that their cost of learning is minimized.
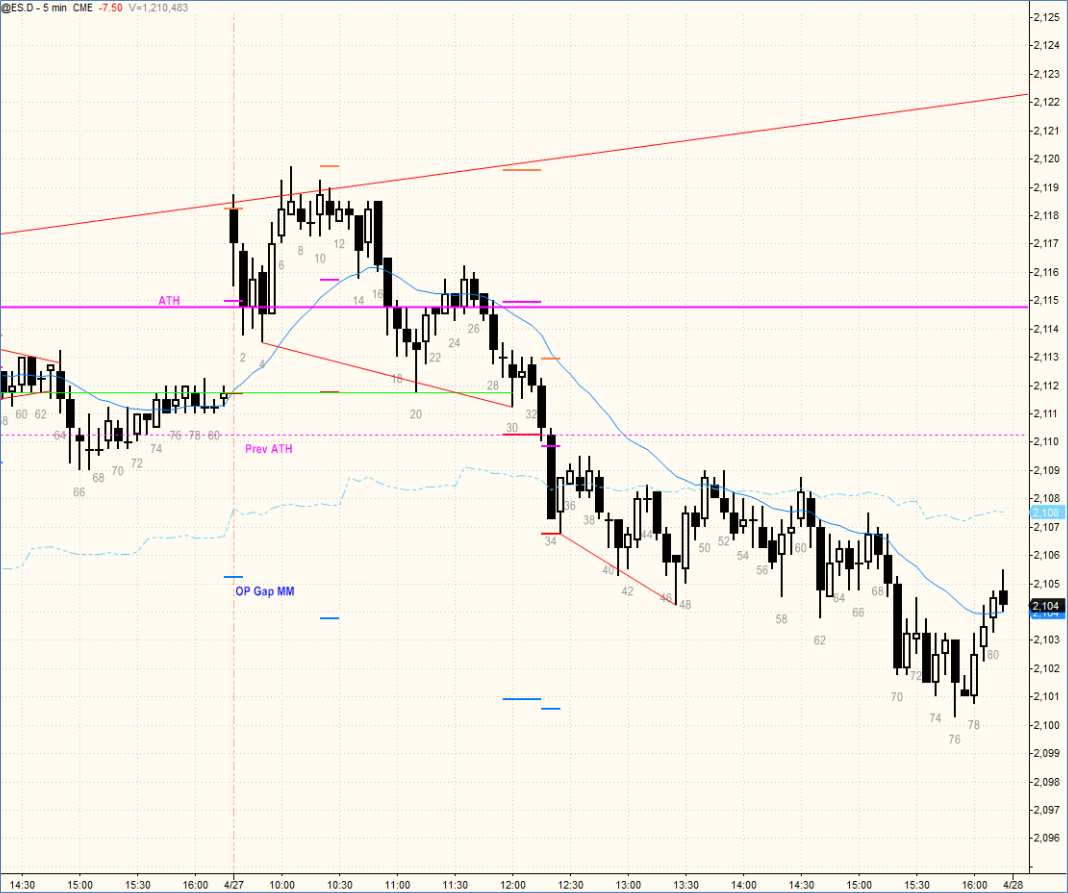
The other factor affecting the position size is market volatility. It can be seen as either the volatility itself or how far your stop should be to ensure technically sound trading. Depending on where you enter into a new trade, your stop might need to be far away. This situation is similar to trading in a high volatility environment where bars are huge and force traders to risk many points in order to trade correctly. For example, entering on top of a five-point bull spike as it is developing and going up fast means the stop it at the bottom of the spike, therefore the position size must be reduced to keep the capital exposure constant.
You can also use different initial risk percentages based on the setup you see on the chart. For example, you might like to risk only 0.5% for entering into a lower probability setup when you are less sure of the outcome, but 1.5% on a strong high probability setup.
I have developed an Excel table that takes all of the above parameters into account to calculate a range of acceptable position sizes for different initial risk values. The next section explains the concept.
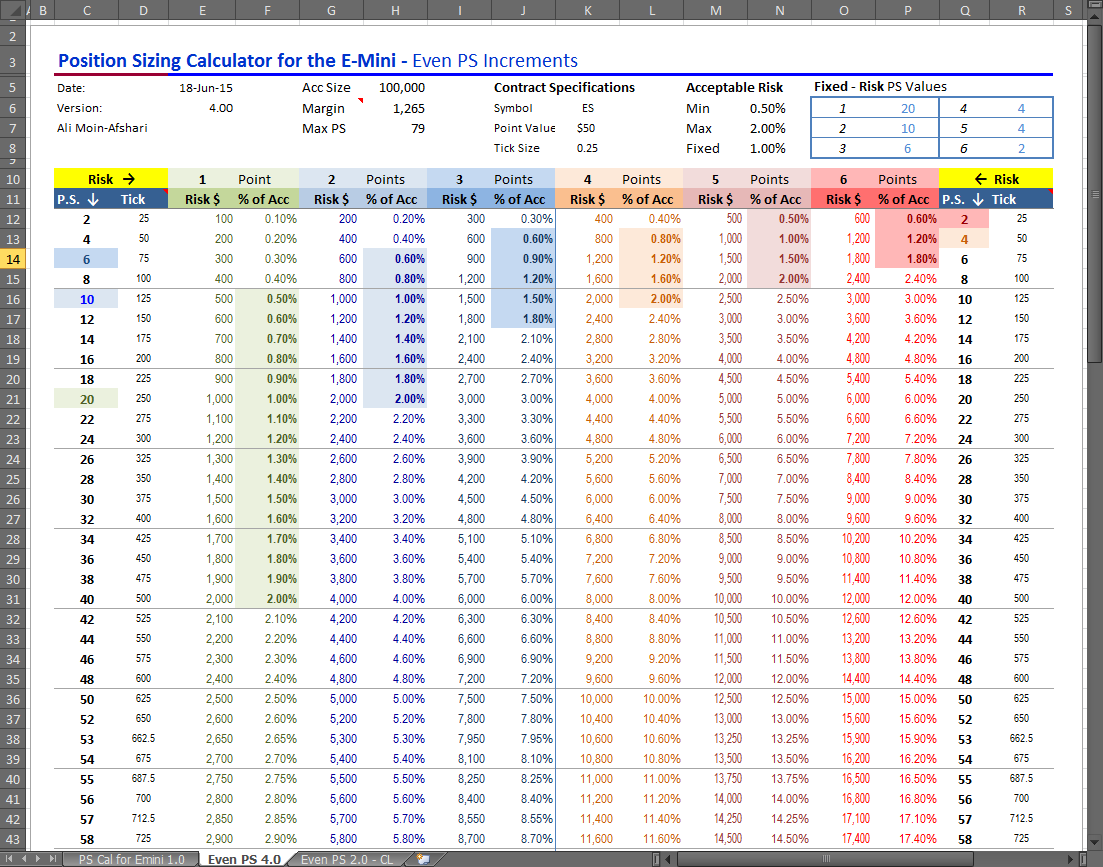
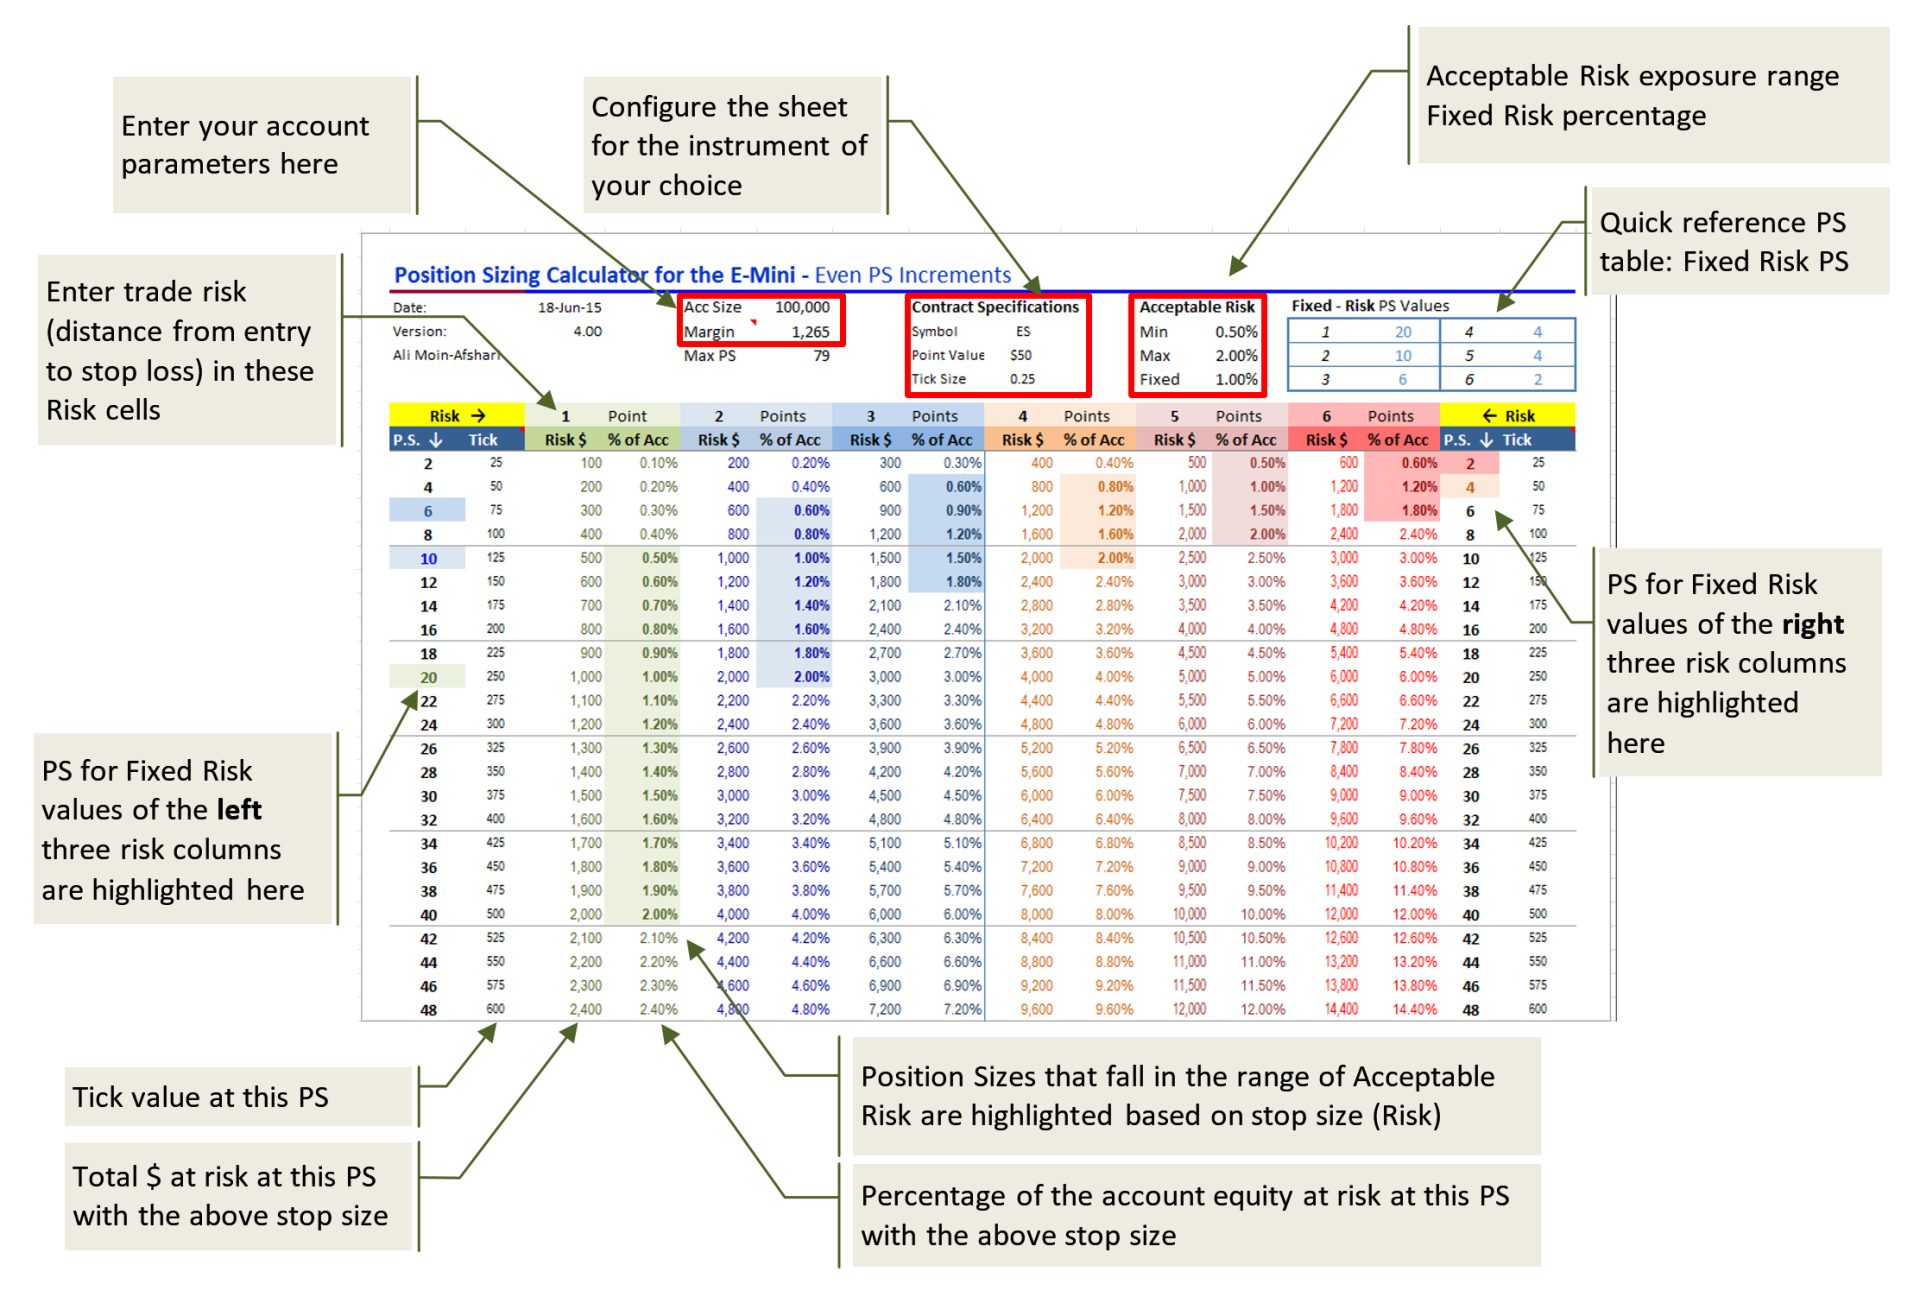
Look at the Excel sheet below. I designed it to work as a programmable reference table. It allows traders to enter the specification of the instrument they are trading on the top, along with their acceptable range of initial risk and account size. On the bottom, Excel calculates a table that highlights how many shares or contracts can be traded based on different initial risk values.
The current inputs consider the following:
- Account size (trading capital) of $100,000
- Intraday margin of $1,265 (this is the TradeStation day trading margin for the ES)
- Contract: ES (the S&P500 e-mini futures contract)
- Acceptable Risk: range of 0.5% – 2.00%
- Fixed Risk: 1%
- Risk intervals are programmed from 1 to 6 ES points at 1 point increments
The table quickly highlights position sizes that fall into the acceptable risk range at each initial risk interval. You can even change the initial risk value during the day when considering a new trade that might require a different stop.
I keep the Excel open under my active window or on my side monitor in case I need to quickly take a look. It helps me reduce my overhead and increase my accuracy by avoiding position sizing mistakes.
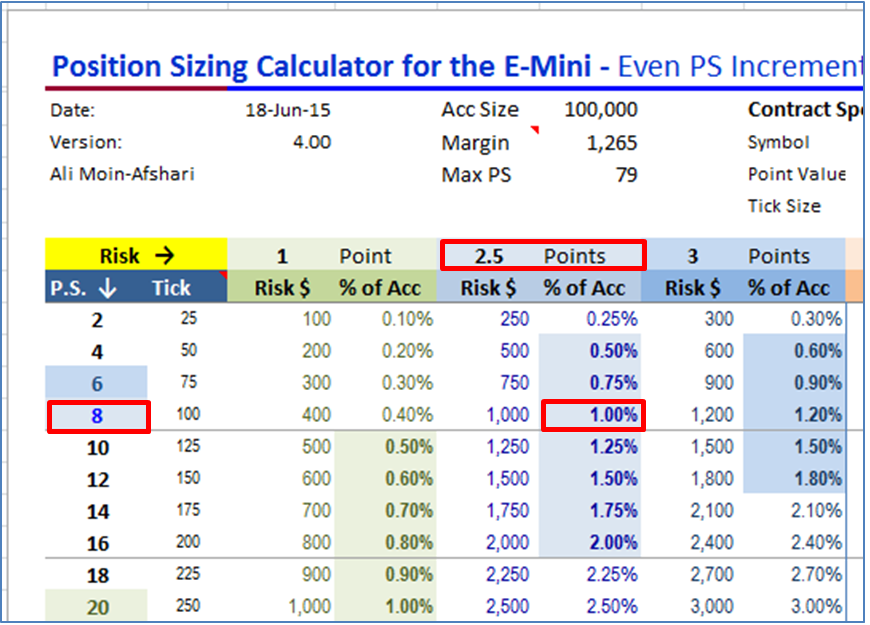
For example, if the initial stop must be 2 points away and the setup is strong, I might be willing to go for the full 2% initial risk. Looking down the left light blue column (2 Points), I find the 2% highlighted cell and cross reference it to the left to find the right number of ES contracts in the P.S. column, which is 20 in this case. So, with these parameters, I can quickly enter a new order for 20 contracts without having to calculate it in my head, possibly avoid making mistakes, and keep the risk in line with my trading rules.