In the previous two parts of this series we analyzed price trends, explored why band trading works, and looked at how some of the popular bands are built and used. This part looks at Standard Error (SE) Bands and why it is considered a superior band. I will not get into mathematical details in favor of space.
One of the best ways to build trading tools is to use advanced statistical techniques to analyze price action. Typically, bands are built around a central trend line. Therefore, statistical methods that measure trends can be used to define the core bands component — the trend line. Regression analysis is a statistical method with several different applications, among them is trend identification. SE Bands are built on the concept of linear regression.
Price data has three components: long-term or secular trend, short-term trends or cycles, and time. Regression analysis uses statistical measurements to identify the main component of a time series — the trend. Regression analysis can identify price direction over a specific time period without being influenced by cyclic patterns or short-term trend. The part of data that cannot be explained by these three elements is considered random or unaccountable price action.
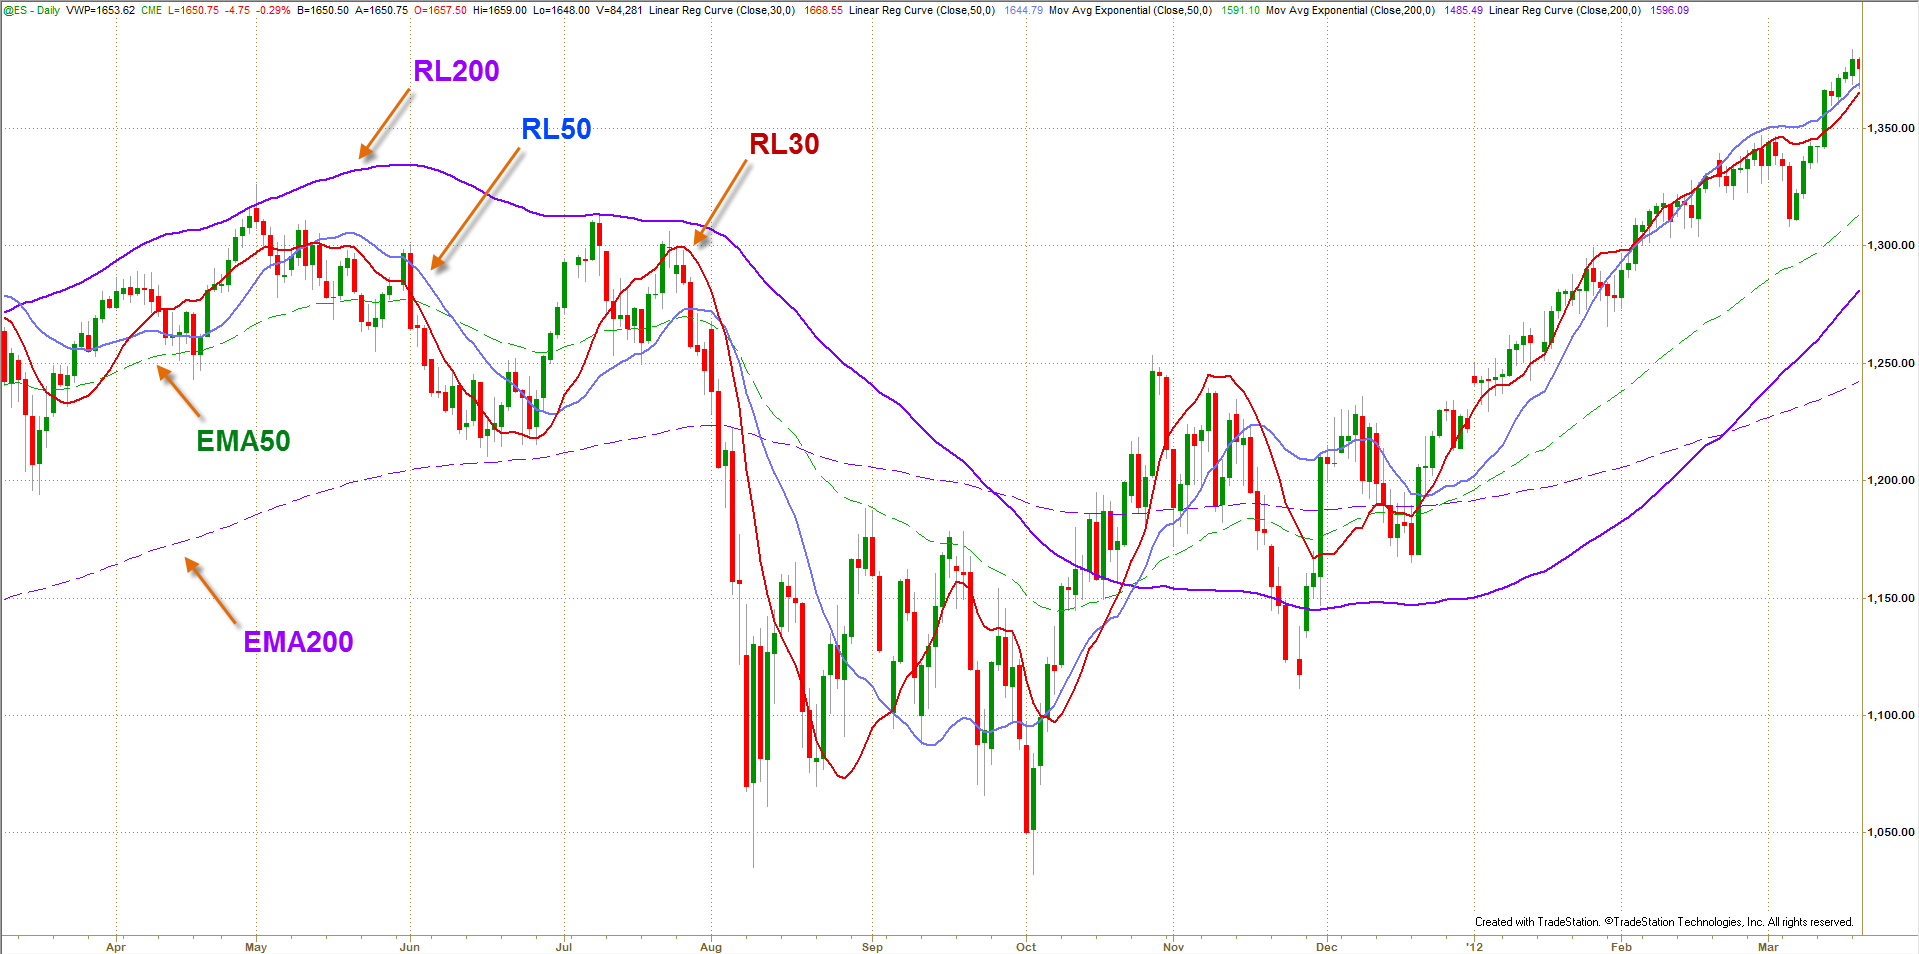
Figure 1: One Year Daily Chart of the ES (S&P 500 futures):
Do you believe an indication of bull markets is when price is above EMA200? Comparison of different lengths of Linear Regression lines (curves) with Exponential Moving Averages shows linear regression identifies trend sooner and more accurately than moving averages.
Selection of a calculation period is important in regression analysis. Different calculation lengths can be used to isolate shorter-term trend within longer term ones, which otherwise would be classified as random. Since short-term trends lead to long-term trends and the end of an old trend is preceded by changes to short-term price behavior, regression analysis provides an effective tool for finding and trading trends.
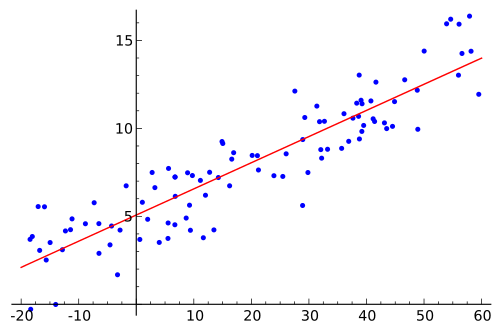
Figure 2: A Scatterplot and Linear Regression Line:
If each dot considered as the closing price, regression line defines the trend
Linear regression lines can be thought of as statistically-based trend lines. The mathematical method used to calculate the regression value is called “the least-squares method.” The regression line is drawn straight through the center of the data such that it is the best overall trend line of data points above and below it. This line represents the equilibrium point of the data since half of the data points are above the line and half are below. Extreme values above or below the line tend to retrace towards the regression value.
Throughout the development and testing of a trading system, we want to know if the results we are seeing are as expected. The answer will always depend on the size of the data sample and the amount of variance in the data during this period.
One descriptive measure called the Standard Error (SE) uses the variance which estimates the error based on the distribution of the data using multiple data samples. It is a test that determines how the sample means differ from the actual mean of all the data. It addresses the uniformity of the data.
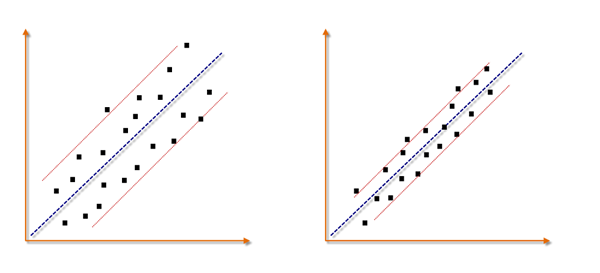
Figure 3: Standard Error as a Measure of Volatility around a Regression Line:
Standard Error decrease in an efficient trend and expands in a volatile trend
Put simply, standard error is an estimate of how close to the population mean (i.e. linear regression line) your sample mean is likely to be (Fig. 3), whereas standard deviation is the degree to which individuals within the sample differ from the sample mean (i.e. average price or moving average line). Standard error should decrease with larger sample sizes, as the estimate of the population mean improves. Standard deviation will be unaffected by sample size.
Standard error can be used as a measure of volatility around a regression line (Figure 4 below). Data points produced from an efficient trend are generally tightly dispersed around a regression line. There are no or very few outliers and the regression line is a good representation for the trend. As volatility expands, closing prices scatter and data points are found at various distances to the regression line, which increase the standard error of variance. Therefore, the accuracy of regression can be estimated by calculating the standard error of variation. In trading, volatility can be measured by calculating the standardized variation around the regression line and used to estimate the accuracy of regression. In other words, standard error tells you how reliable your trend line (i.e. regression line) is at each price bar.
The above concepts can be applied to band trading to create a band that can tell us at the close of each bar:
- Do you place a trade the moment price crosses the trendline during the trading session?
- Or do you believe in the importance of the closing price and wait for the price to close on the other side of the moving average?
- Would you prefer to wait for the trendline to establish a direction before placing a trade?
If you subscribe to the closing price belief, your trading rules will be:
- Is new price action conforming uniformly to past price action?
- Is trending behavior expected to continue?
- How efficient is the trend?
- Is the amount of noise in price action increasing or decreasing?
- Is price action in a sideways channel?
- If price is consolidating, is trending behavior expected to begin?
Standard Error bands were invented by Jon Andersen as a trend following indicator. SE Bands are built around a linear regression line using the standard error of regression. First the linear regression value is calculated. Then a short term simple moving average of it is calculated to smooth it out. Next, the standard error value is calculated and smoothed similarly. Then, the first average is plotted and the second average (SMA of SE) is multiplied by ±2 and plotted up and down. Andersen recommend following values for SE bands:
- Number of periods: 21,
- SMA smoothing: 3 periods, and
- Standard error multiplier: ±2
The interpretation of SE bands is very different from Bollinger Bands:
- Tight bands indicate standard error is low and price is moving orderly in the direction of the prevailing trend. One can expect the current trend to continue.
- When bands are wide or expanding there is a higher chance that current trend might slow down, go sideways, or even reverse. Price is losing its directionality and momentum, which means noise is increasing.
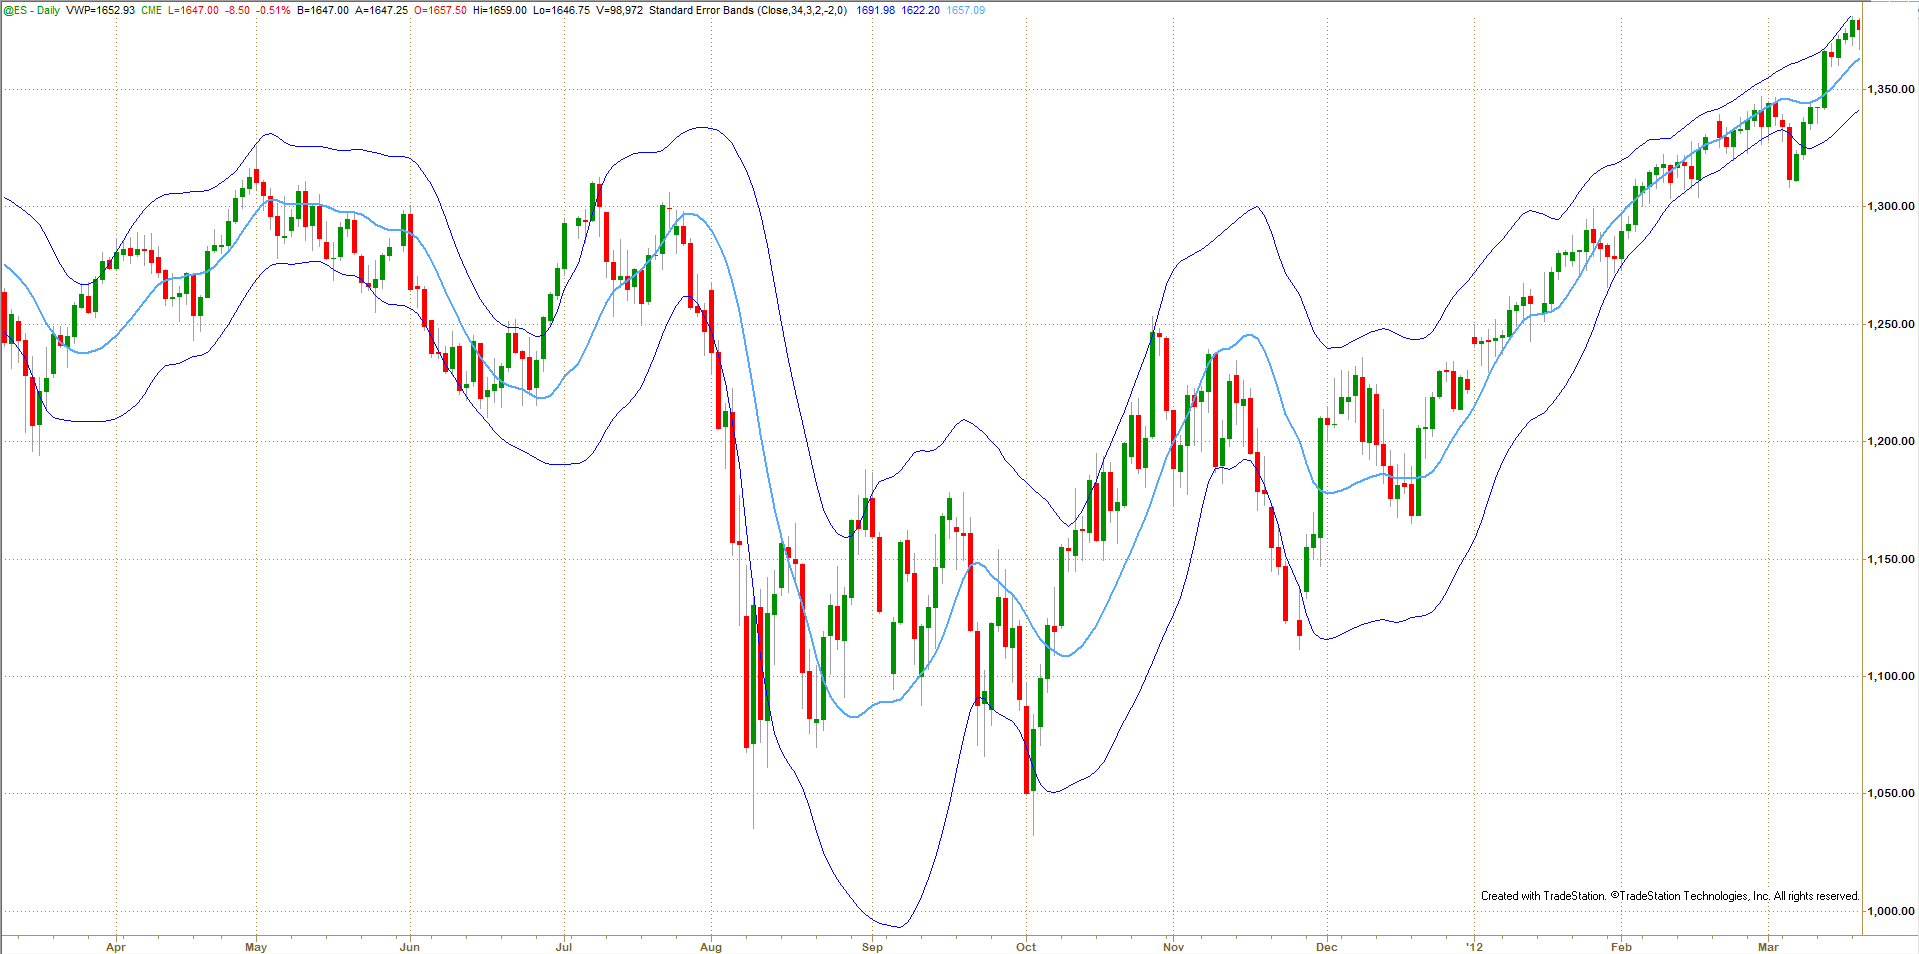
Different look back periods and other SE multipliers produce different results. For example, I like longer SE bands such as the 34-period SEB depicted in figure 5. In this case, one of my trading systems says: Enter after two subsequent closes outside the bands in the direction of the RL, when bands are narrow. If I am in a trade already, stay with the trend.
Figure 5: Standard Error Bands:
1-Year Daily chart of ES with 34-period SEB at ±2 Standard Errors
SE bands do not have the lagging problems of Bollinger bands and to some extent Keltner channel, discussed in part 2 of this series. SE bands react more quickly to changes in price action and generate signals much faster than other band techniques. Since SE bands are based on regression analysis, the bands are build around a true mathematical measure of price trend rather than the less accurate average price used by other bands. Figure 1 shows there is a considerable difference between same period EMAs and RLs.
Regression analysis helps traders analyze trends more accurately and SE bands can help them understand the reliability of the trend. SE bands offer a number of trading system development opportunities once traders understand how they interact with price. In the last article of this series, we will explore ideas for building a trading system based on bands.
“Man has two legs, Money has four. Let Money chase you.”
– Chinese Proverb