In this four article series, I will discuss why I believe that band trading works. My goal is to provide a concise overview of several band techniques and the strengths and weaknesses of each. To start the series, I will discuss trends – without which, bands would not work. In parts 2 and 3, I will show how bands can help trend following systems. In part four, I will discuss one of the lesser known yet more effective band techniques which I use in my own trading, SE Bands.
Band trading systems depend on trends to work so let’s leave bands alone at first and answer a more fundamental question: why do trend systems work? Once we answer that question, then we can evaluate how bands might help trend systems. Without a trend, bands can be as useless as any other analysis technique in a trend-less market.
Trends are the basis of many successful trading programs. Being able to identify the trend is important if you want to trade “the right side of the market”.
Trend systems work because:
- Fundamental factors tend to move prices.
- Money moves the markets. Most trends are supported by the flow of investor funds. This causes both short-term noise and the long-term trend. As a trend becomes clearer to the general public, additional money typically flows in to help continue the trend.
- Prices are not normally distributed but have a fat tail. The fat tail means that there is an unusually large number (by statistically normal standards) of directional price moves that are larger and/or longer than would occur from randomly distributed prices. Fat tails generate exceptional profits which are essential to most trend systems’ long-term success.
Trend trading works when markets are trending and stops working in sideways conditions. When markets move sideways, it’s best to use other methods and when markets are trending, there is no one best trending method that is always best. I have found that most trend following methods have similar returns over time but also have different risk profiles. Risk profiles and trading frequency distinguish one trend method from another.
One way to measure trends is with moving averages. By netting all prices, a moving average removes noise and shows the underlying price direction.
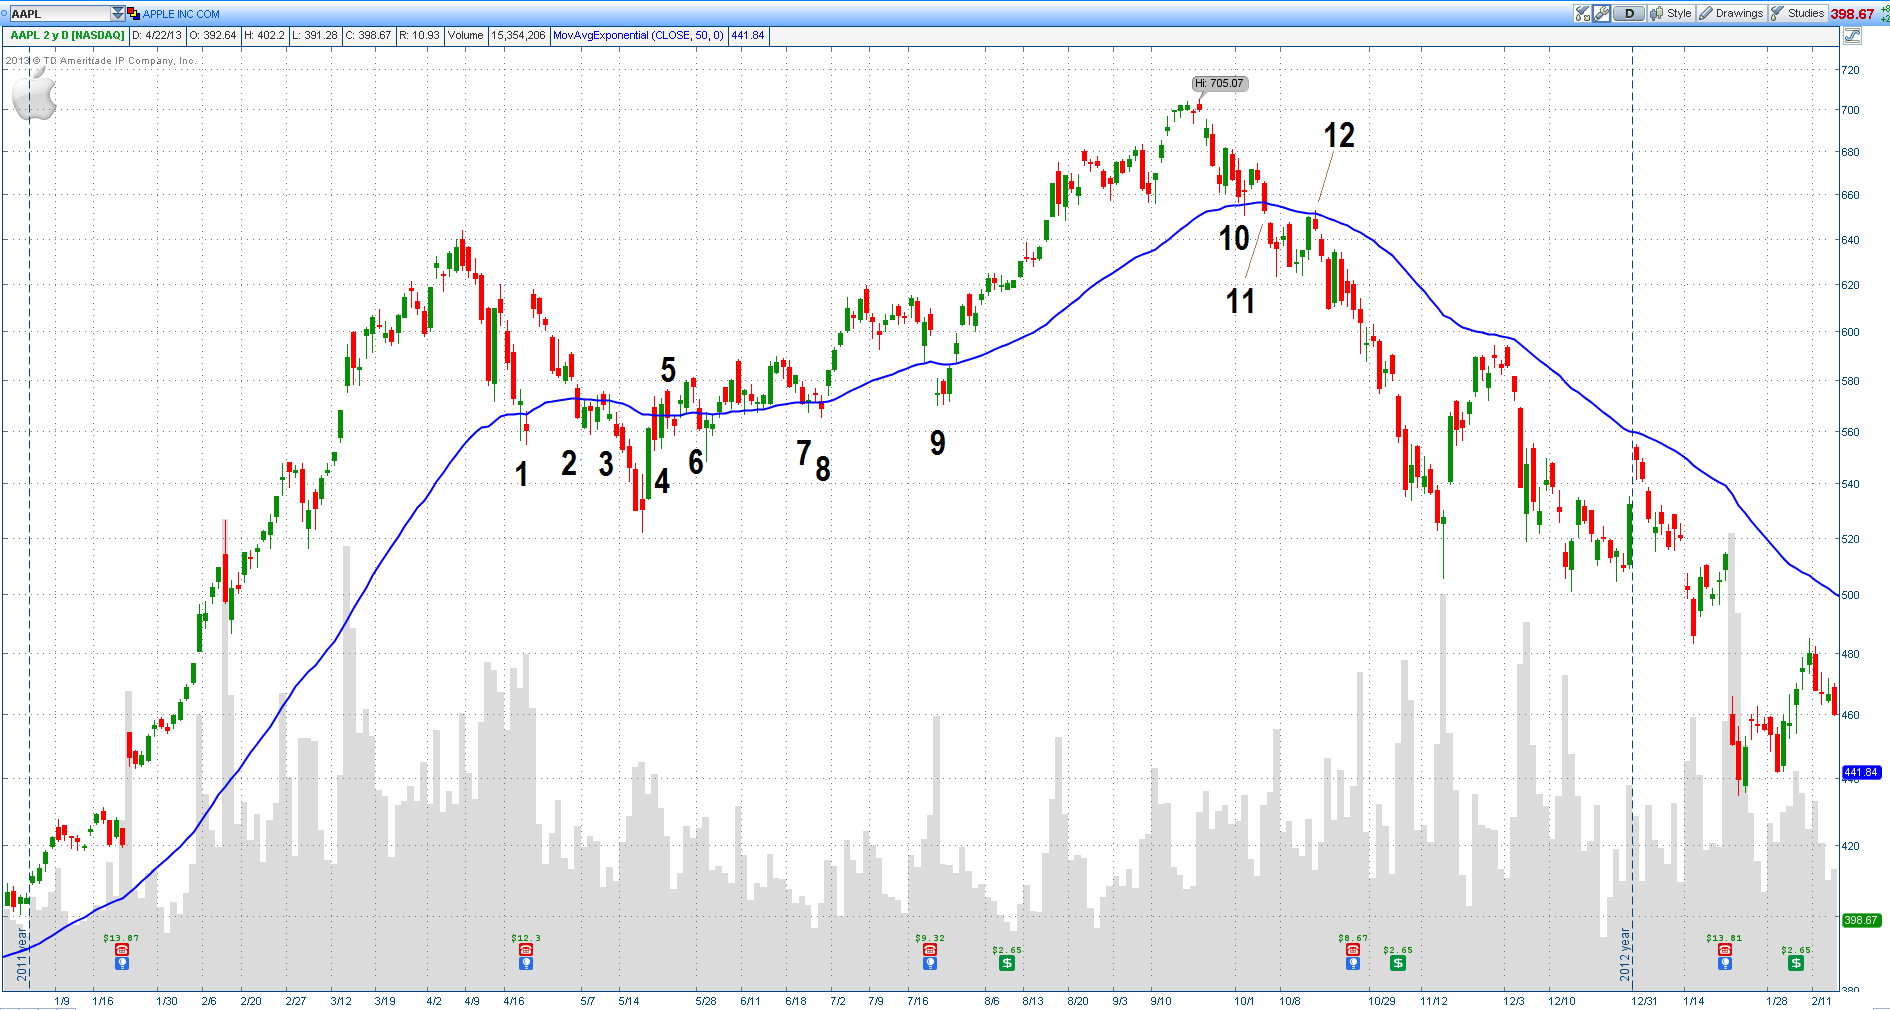
Figure 1: Daily Chart of Apple Computer with 50-day Exponential Moving Average
The basic idea behind using the moving average as a trend signal is to be long when prices are above the average and short when below. A very simple set of rules would be:
- Buy: when price crosses above the trendline.
- Sell: when price crosses below the trendline.
By following these rules, you can see in Figure 1 how Apple’s price dropped below the EMA ten times over six months before it finally established a new bear trend at bar 11 and stabilized at bar 12. If “crossing” the moving average was your only criteria, this scenario had ten losing short trades before catching the bear trend at bar 11.
At this point you must make important decisions:
- Do you place a trade the moment price crosses the trendline during the trading session?
- Or do you believe in the importance of the closing price and wait for the price to close on the other side of the moving average?
- Would you prefer to wait for the trendline to establish a direction before placing a trade?
If you subscribe to the closing price belief, your trading rules will be:
- Buy: when price closes above the trendline.
- Sell: when price closes below the trendline
If you gravitate more to the moving average direction belief, and also believe in closing prices, your rules will turn into:
- Buy: when the change in the trendline is up AND price closes above the trendline.
- Sell: when the change in the trendline is down AND price closes below the trendline.
A moving average tends to lag price movement and this characteristic is both a disadvantage and an advantage. Figure 1 shows price crossing below the 50 day EMA at bar #10 – a few days ahead of the point where the average turned down in October. On the other hand, the benefit using the moving average signal is that the trend turn is clear and more stable. During April (bars 1-3) and July (bars 7-9), price crossed back and forth through the EMA but in both cases, the EMA maintained its direction; therefore the trend signal remained the same.
To show what kind of results you might get with a simple moving average system, I back-tested a simple trend following system on ten years of Nasdaq 100 futures data. I used a 50-day calculation period for the MA because typically, many traders pay attention to it and it seems to be fast enough to identify major price trends. Buy and sell signals were generated from the direction of the trendline. For this test, I assumed zero slippage and zero transaction fees.
Due to space limitations, I cannot present all of the data and other details of the test, but here are the results:
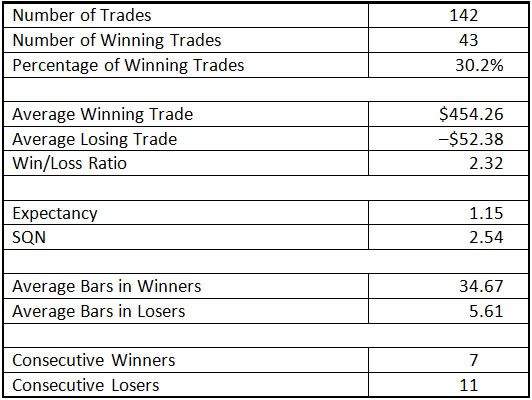
Figure – 2: Profile of a Moving Average System
These results are consistent with other similar, well-documented trend system results in published literature. In general, trend-following systems generate this same basic profile:
- The percentage of profitable trades is low, often about 30%, sometimes less.
- Winning trades are held much longer on average than losing trades.
- The average winning trade must be significantly larger than the average losing trade to produce a positive expectancy. Given only 30% profitable trades, the ratio must be greater than 100:30 (or 10:3) to be profitable.
- There are lots of losing trades and long losing streaks in trend systems.
Many traders have tried improving on the above general profile with some success, but not without changing the risk characteristics of trend-following systems. For example, you can add any or both of the following measure:
- Add a profit taking exit
- Add a more complex or adaptive stop loss
Both measures, however, reduce or eliminate the chance of capturing the important fat tails which then adversely affects the long-term profitability of the system.
In this article, we looked briefly at price trends and how using moving averages can help monitor trends or even be the basis for a simple trading system.
In part two of this series, we will study some popular band and channel trading techniques and analyze how they might improve the performance of a trend following system.
“It is not the strongest of the species that survive, nor the most intelligent, but the ones most responsive to change.”
– Charles Darwin